Graph
Why are my TCP requests disconnected in the graph?
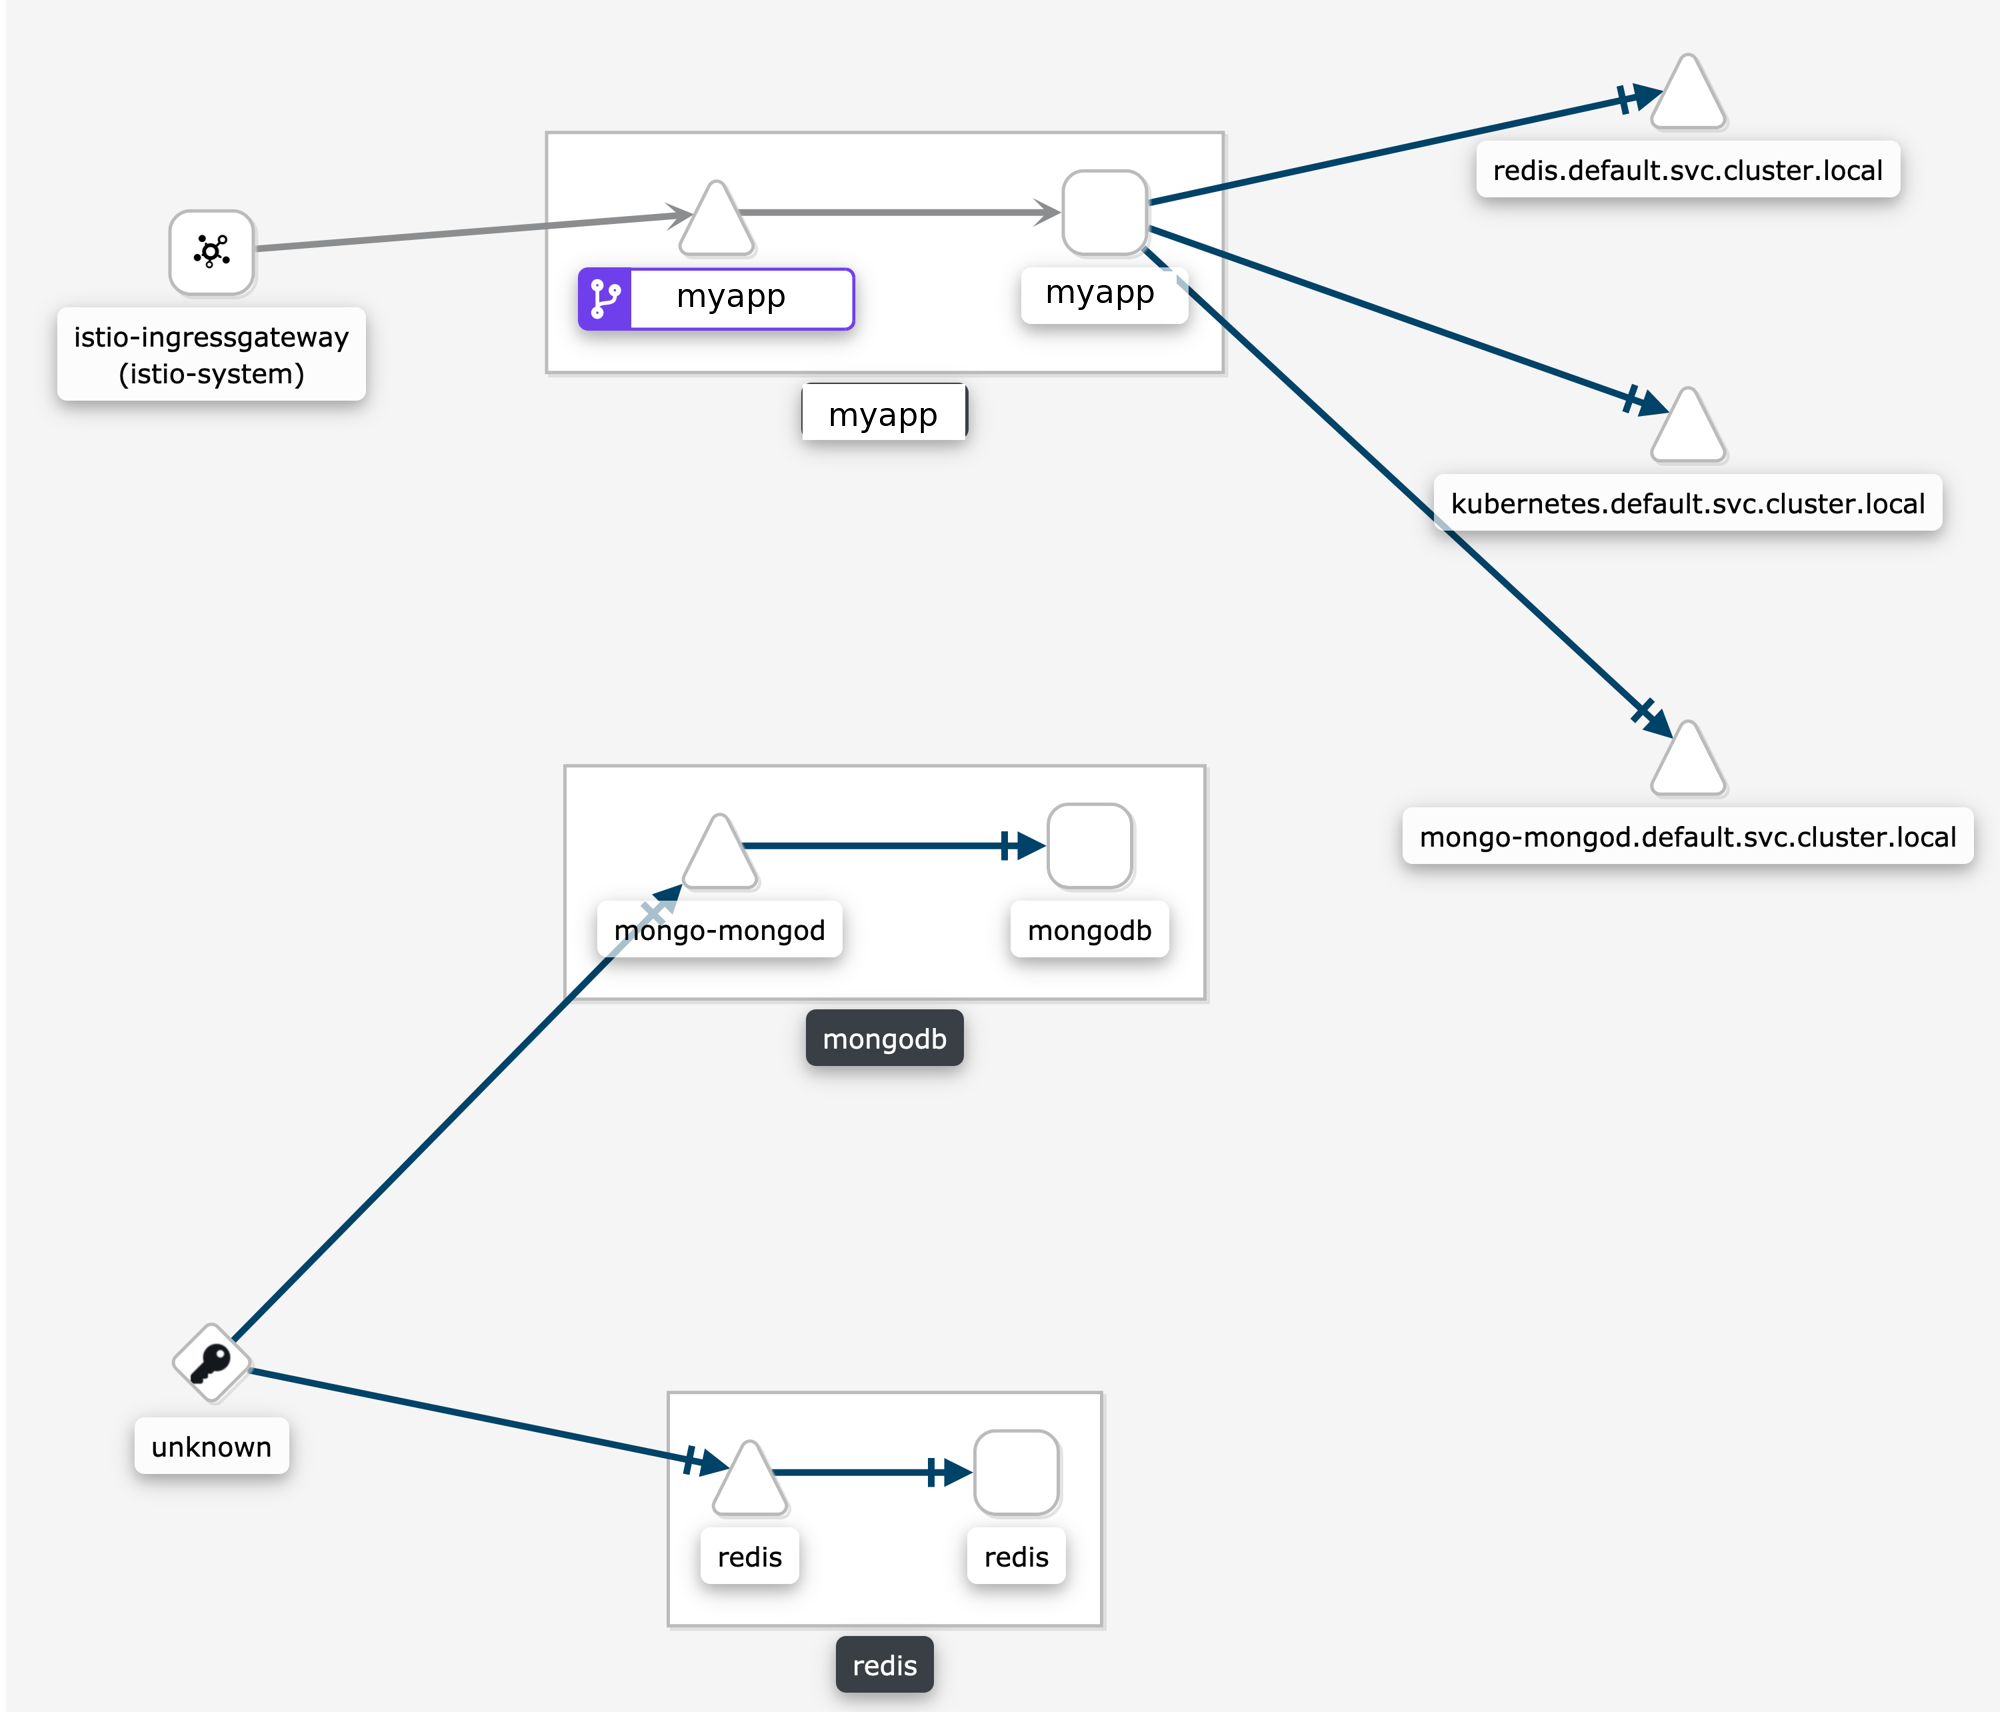
Some users are surprised when requests are not connected in the graph. This is normal Istio telemetry for TCP requests if mTLS is not enabled. For HTTP requests, the requests will be connected even without MTLS, because Istio uses headers to exchange workload metadata between source and destination. With the disconnected telemetry you will see an edge from a workload to a terminal service node. That’s the first hop. And then another edge from “Unknown” to the expected destination service/workload. In the graph below, this can be seen for the requests from myapp to redis and mongodb:
Why my external HTTPS traffic is showing as TCP?
Istio can’t recognize HTTPS request that go directly to the service, the reason is that these requests are encrypted and are recognized as TCP traffic.
You can however configure your mesh to use TLS origination for your egress traffic. This will allow to see your traffic as HTTP instead of TCP.
Why is the graph badly laid out?
The layout for Kiali Graph may render differently, depending on the data to display (number of graph nodes and their interactions) and it’s sometimes difficult, not to say impossible, to have a single layout that renders nicely in every situation. That’s why Kiali offers a choice of several layout algorithms. However, we may still find some scenarios where none of the proposed algorithms offer a satisfying display. If Kiali doesn’t render your graph layout in a satisfactory manner please switch to another layout option. This can be done from the Graph Toolbar located on the bottom left of the graph.
If Kiali doesn’t produce a good graph for you, don’t hesitate to open an issue in GitHub or reach out via the usual channels.
Why are there many unknown nodes in the graph?
In some situations you can see a lot of connections from an “Unknown” node to your services in the graph, because some software external to your mesh might be periodically pinging or fetching data. This is typically the case when you setup Kubernetes liveness probes, or have some application metrics pushed or exposed to a monitoring system such as Prometheus. Perhaps you wouldn’t like to see these connections because they make the graph harder to read.
From the Graph page, you can filter them out by typing node = unknown in the Graph Hide input box.

For a more definitive solution, you could have these endpoints (like /health or /metrics) exposed on a different port and server than your main application, and to not declare this port in your Pod’s container definition as containerPort. This way, the requests will be completely ignored by the Istio proxy, as mentioned in Istio documentation (at the bottom of that page).
Why do I have missing edges?
Kiali builds the graph from Istio’s telemetry. If you don’t see what you expect it probably means that it has not been reported in Prometheus. This usually means that:
1- The requests are not actually sent.
2- Sidecars are missing.
3- Requests are leaving the mesh and are not configured for telemetry.
For example, If you don’t see traffic going from node A to node B, but you are sure there is traffic, the first thing you should be doing is checking the telemetry by querying the metrics, for example, if you know that MyWorkload-v1 is sending requests to ServiceA try looking for metrics of the type:
istio_requests_total{destination_service="ServiceA"}
If telemetry is missing then it may be better to take it up with Istio.
Which lock icons should I see when I enable the Kiali Graph Security Display option?
Sometimes the Kiali Graph Security Display option causes confusion. The option is disabled by default for optimal performance, but enabling the option typically adds nominal time to the graph rendering. When enabled, Kiali will determine the percentage of mutual TLS (mTLS) traffic on each edge. Kiali will only show lock icons on edges with traffic for edges that have > 0% mTLS traffic.
Kiali determines the mTLS percentage for the edges via the connection_security_policy attribute in the
Prometheus telemetry. Note that this is destination telemetry (i.e. reporter="destination").
Why can’t I see traffic leaving the mesh?
See Why do I have missing edges?, and additionally consider whether you need to create a ServiceEntry (or several) to allow the requests to be mapped correctly.
You can check this article on how to visualize your external traffic in Kiali for more information.
Why do I see traffic to PassthroughCluster?
Requests going to PassthroughCluster (or BlackHoleCluster) are requests that did not get routed to a defined service or service entry, and instead end up at one of these built-in Istio request handlers. See Monitoring Blocked and Passthrough External Service Traffic for more information.
Unexpected routing to these nodes does not indicate a Kiali problem, you’re seeing the actual routing being performed by Istio. In general it is due to a misconfiguration and/or missing Istio sidecar. Less often but possible is an actual issue with the mesh, like a sync issue or evicted pod.
Use Kiali’s Workloads list view to ensure sidecars are not missing. Use Kiali’s Istio Config list view to look for any config validation errors.
How do I inspect the underlying metrics used to generate the Kiali Graph?
It is not uncommon for the Kiali graph to show traffic that surprises the user. Often the thought is that Kiali may have a bug. But in general Kiali is just visualizing the metrics generated by Istio. The next thought is that the Istio telemetry generation may have a bug. But in general Istio is generating the expected metrics given the defined configuration for the application.
To determine whether there is an actual bug it can be useful to look directly at the metrics collected by and stored in the Prometheus database. Prometheus provides a basic console that can be opened using the istioctl dashboard command:
> istioctl dashboard prometheus
The above command, assuming Istio and Prometheus are in the default istio-system namespace, should open the Prometheus console in your browser.
Kiali uses a variety of metrics but the primary request traffic metrics for graph generation are these:
- istio_requests_total
- istio_tcp_sent_bytes_total
The Prometheus query language is very rich but a few basic queries is often enough to gather time-series of interest.
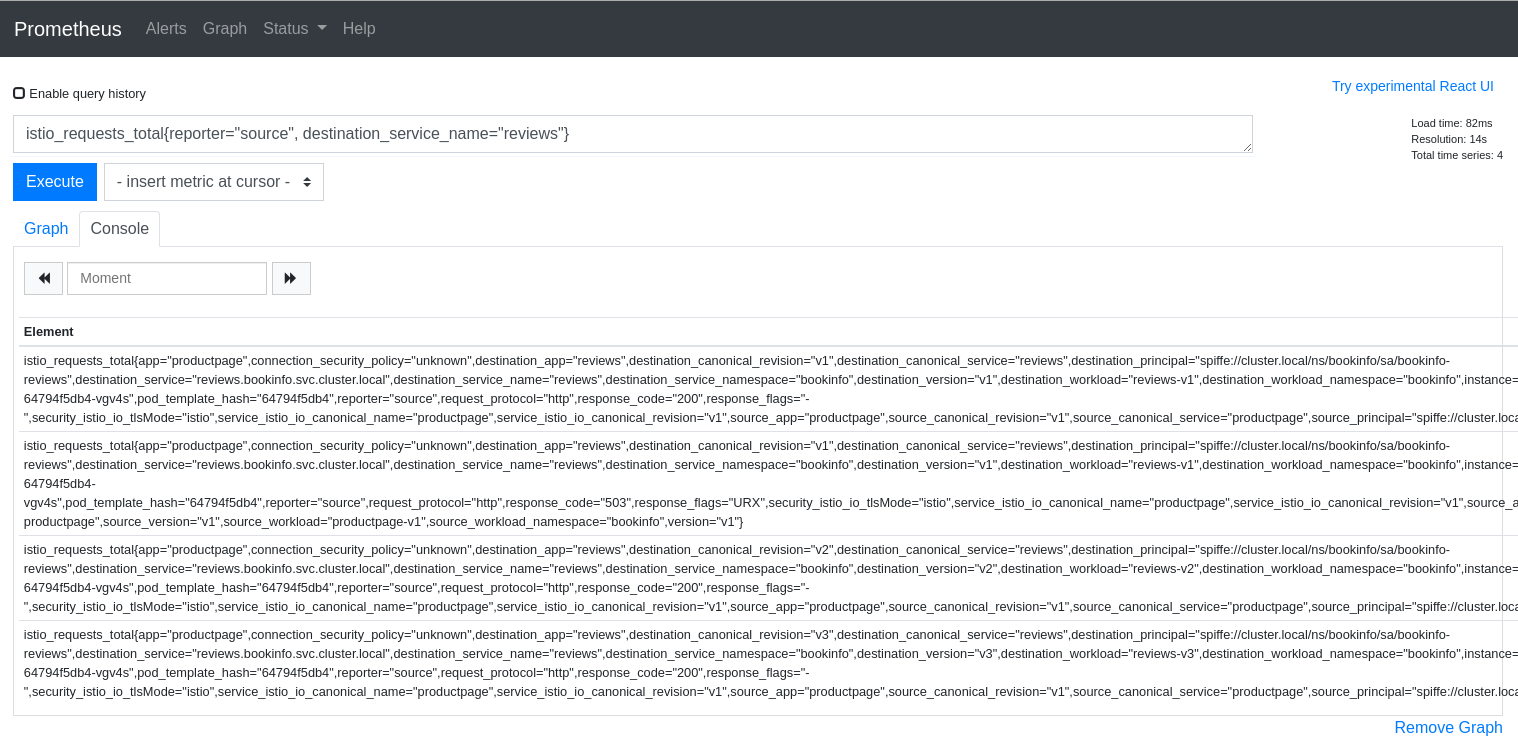
Here is a query that returns time-series for HTTP or GRPC requests to the reviews service in Istio’s BookInfo sample demo:
istio_requests_total{reporter="source", destination_service_name="reviews"}
And here is an example of the results:
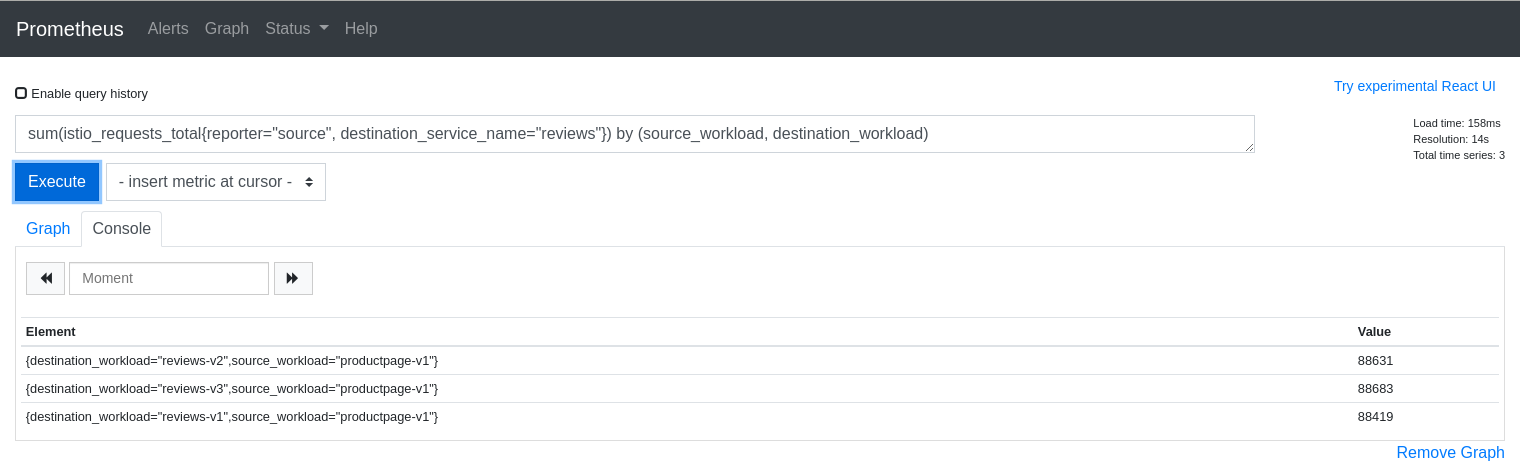
The query above is good for dumping all of the attributes but it can be useful to aggregate results by desired attributes. The next query will get the request counts for the reviews service broken down by source and destination workloads:
sum(istio_requests_total{reporter="source", destination_service_name="reviews"}) by (source_workload, destination_workload)
The first step to explaining your Kiali graph is to inspect the metrics used to generate the graph. Kiali devs may ask for this info when working with you to solve a problem, so it is useful to know how to get to the Prometheus console.
Why don’t I see response times on my service graph?
Users can select Response Time to label their edges with 95th percentile response times. The response time indicates the amount of time it took for the destination workload to handle the request. In the Kiali graph the edges leading to service nodes represent the request itself, in other words, the routing. Kiali can show the request rate for a service but response time is not applicable to be shown on the incoming edge. Only edges to app, workload, or service entry nodes show response time because only those nodes represent the actual work done to handle the request. This is why a Service graph will typically not show any response time information, even when the Response Time option is selected.
Because Service graphs can show Service Entry nodes the Response Time option is still a valid choice. Edges to Service Entry nodes represent externally handled requests, which do report the response time for the external handling.
Why does my workload graph show service nodes?
Even when Display Service Nodes is disabled a workload graph can show service nodes. Display Service Nodes ensures that you will see the service nodes between two other nodes,
providing an edge to the destination service node, and a subsequent edge to the node handling the request. This option injects service nodes where they previously would not be
shown. But Kiali will always show a terminal service node when the request itself fails to be routed to a destination workload. This ensures the graph visualizes problem areas.
This can happen in a workload or app graph. Of course in a service graph the Display Service Nodes option is simply ignored.